How to use Clevercast analytics
The analytics dashboard provides detailed insights into how, where and when your audience consumes video. User engagement history contains a wealth of information for content creators and advertisers on how your content is being consumed.
Much more than mere numbers, these graphs show which portions of your video are being watched, at which point drop-off rates become critical, and what can be done to further engage your audience.
Furthermore the dashboard displays real-time analytics for both live and on demand video, giving you information about video being watched right now. Being able to detect trending content can prove to be priceless, as it allows you to follow up instantly.
Analytics terminology
Clevercast analytics contain the live and/or VoD statistics generated by Clevercast players.
- Active live streams: shows the viewers currently watching a live stream through Clevercast player
- Finished live streams: detailed statistics about live streams that are finished. These statistics are also available while the live stream is running, but will only be 100% accurate after the live stream finishes.
- Currently Watched VoD: shows the viewers currently watching a VoD item through Clevercast player
- Previously Watched VoD: detailed statistics about VoD items that have been watched.
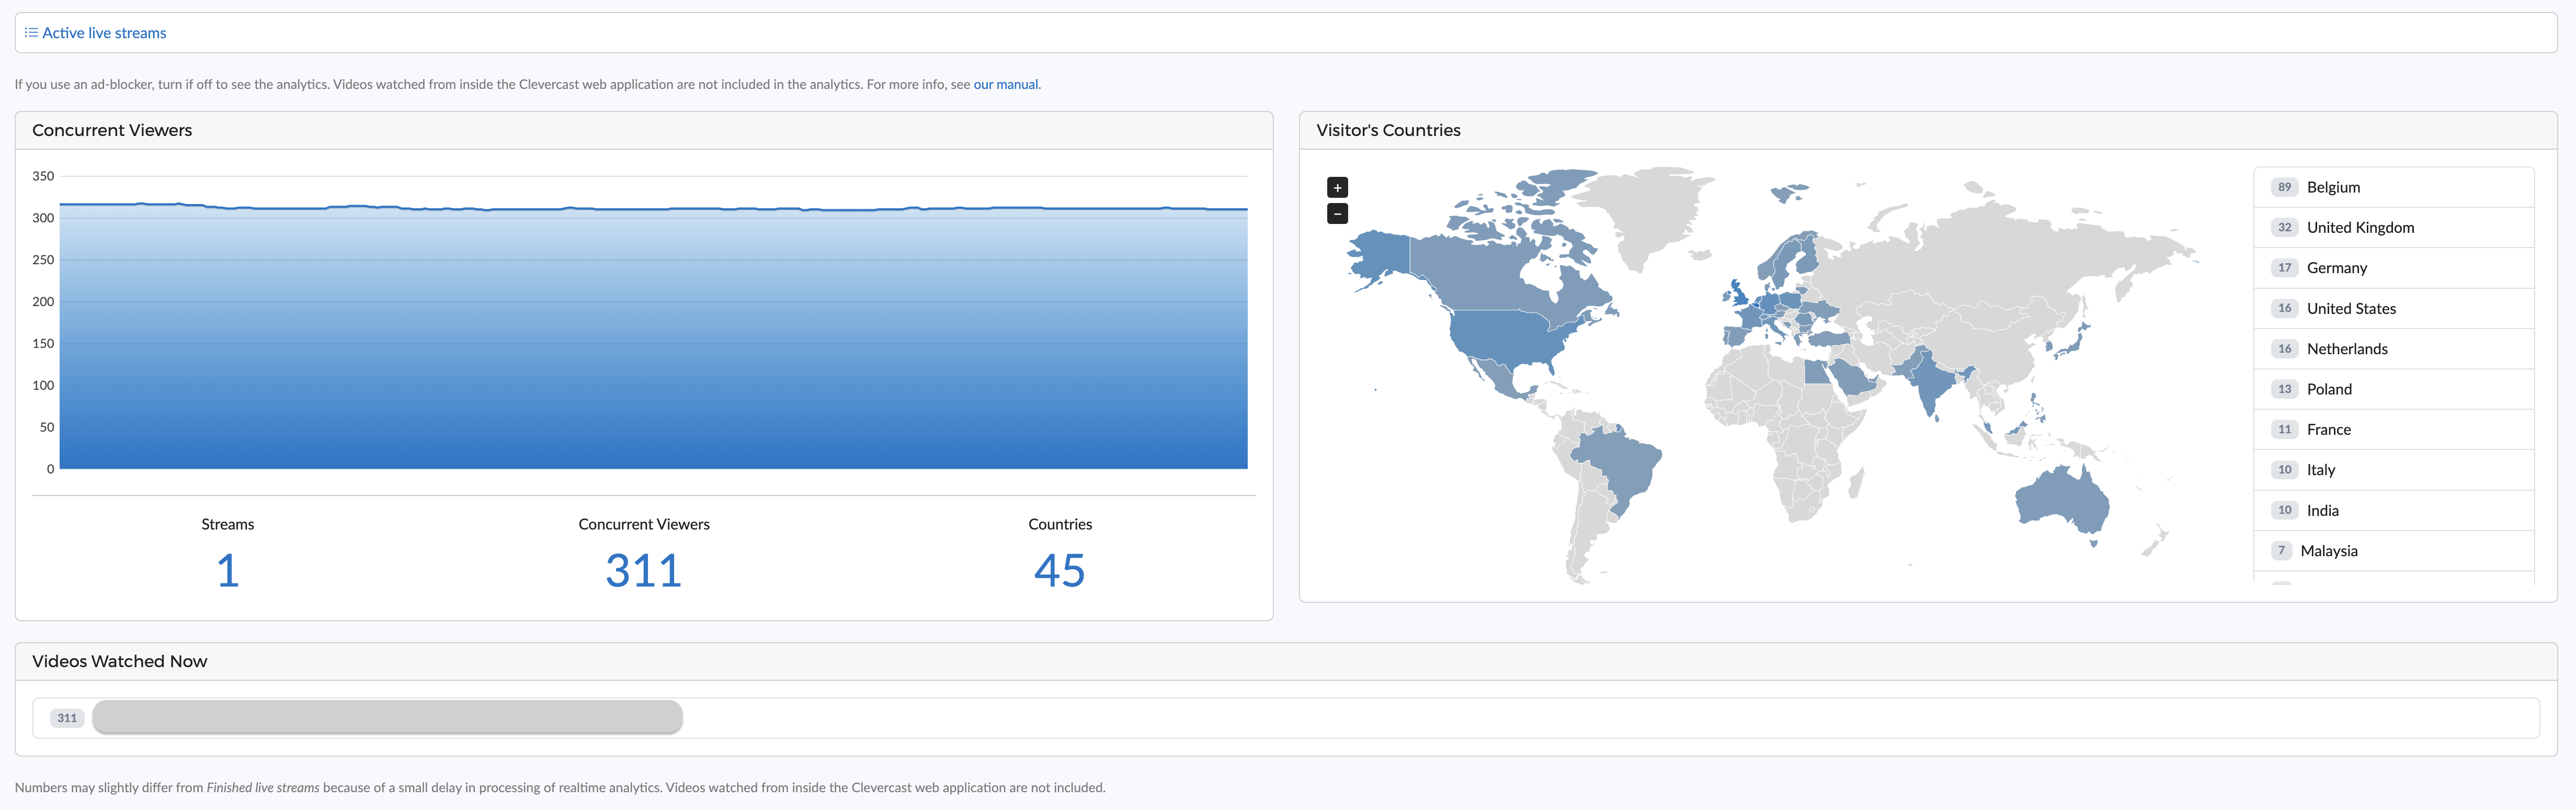
Active live streams
In the Concurrent viewers panel, you can see the number of live streams that are currently being watched, by how many conurrent viewers in how many different countries. In the Visitor's countries panel to the right, you have an overview of these concurrent viewers and their respective countries. Finnaly, in the Videos watched now panel, the title of the specific video appears, along with an amount of viewers per video.
Finished live streams
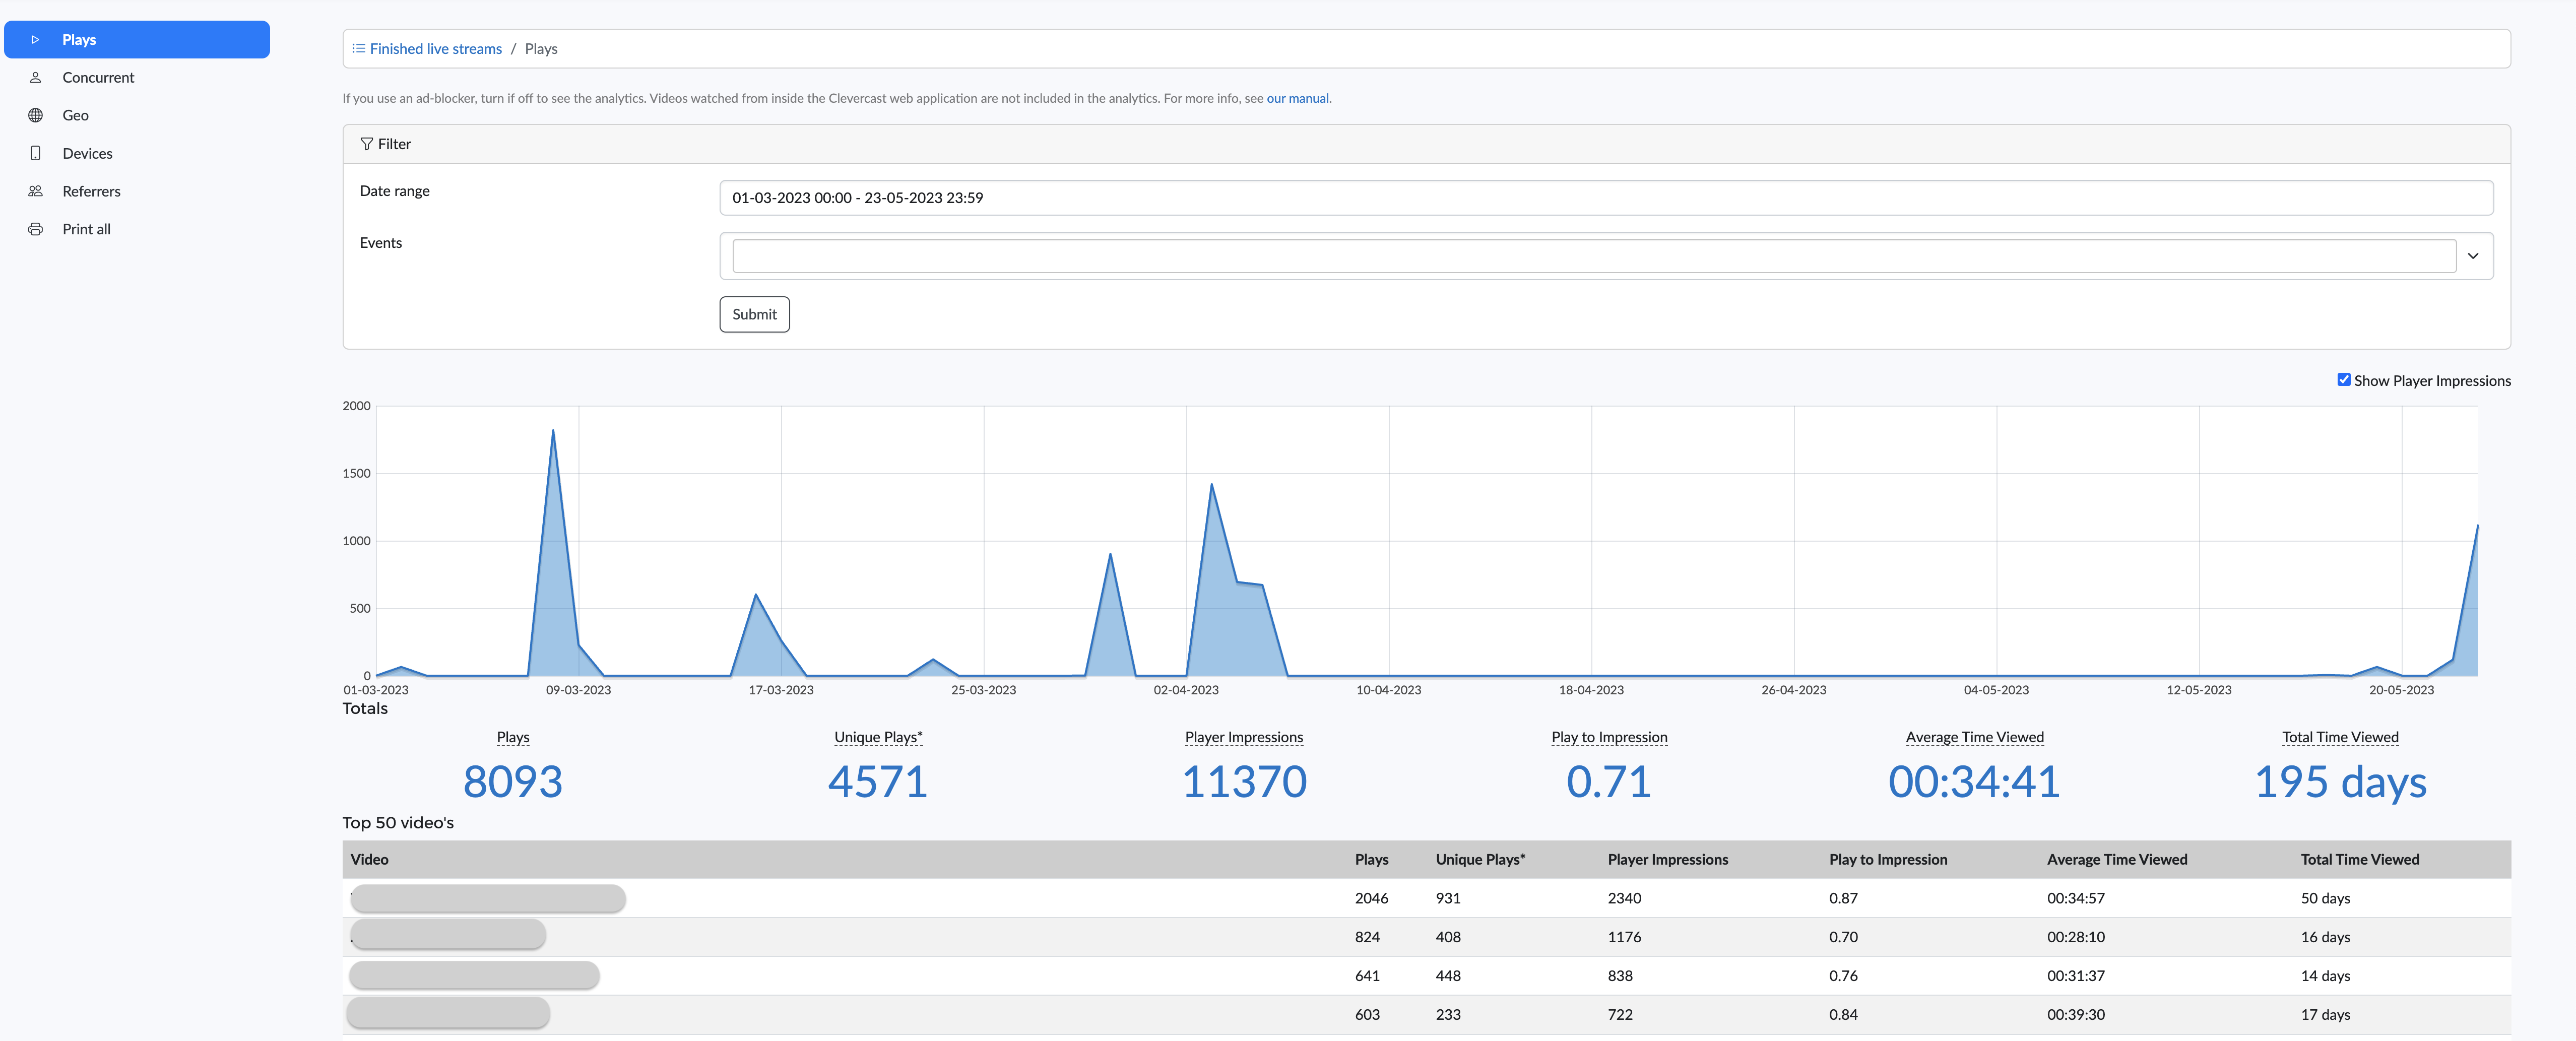
Plays
Select a period of time for which you'd like to see analytics first. Adding a specific event is optional.
There are different ways to look at how the player was used, and consequently, how (many times) a stream was watched. First, check Show Player Impressions (on the right) first in order to get all analytics. Regarding plays, there are four components to discern:
- Plays: is the number of times a playback was started (e.g. by rendering a page with an 'autoplay' player or by pressing the play button).
- Unique Plays: is the number of times a playback was started by a unique viewer. Every unique combination of an IP address, user agent and resolution is considered a unique play. Note that unique viewers from corporate networks are sometimes not detected because they share these traits.
- Player Impressions: is the number of times that a player was loaded (but not necessarily started), usually on a web page.
- Play to Impression: is a scale (or a percentage) from 0 to 1 of how many times video playback was started (0 being no playback was started while 1 means playback was always started).
Additionally, average time viewed represents the duration a unique viewer actually watched on average, while the total time viewed is the sum of all those durations in sum. In addition, below the filter, you'll find an overview of all information per video.
Below you can find an overview of plays with 'Show player impressions' turned on.
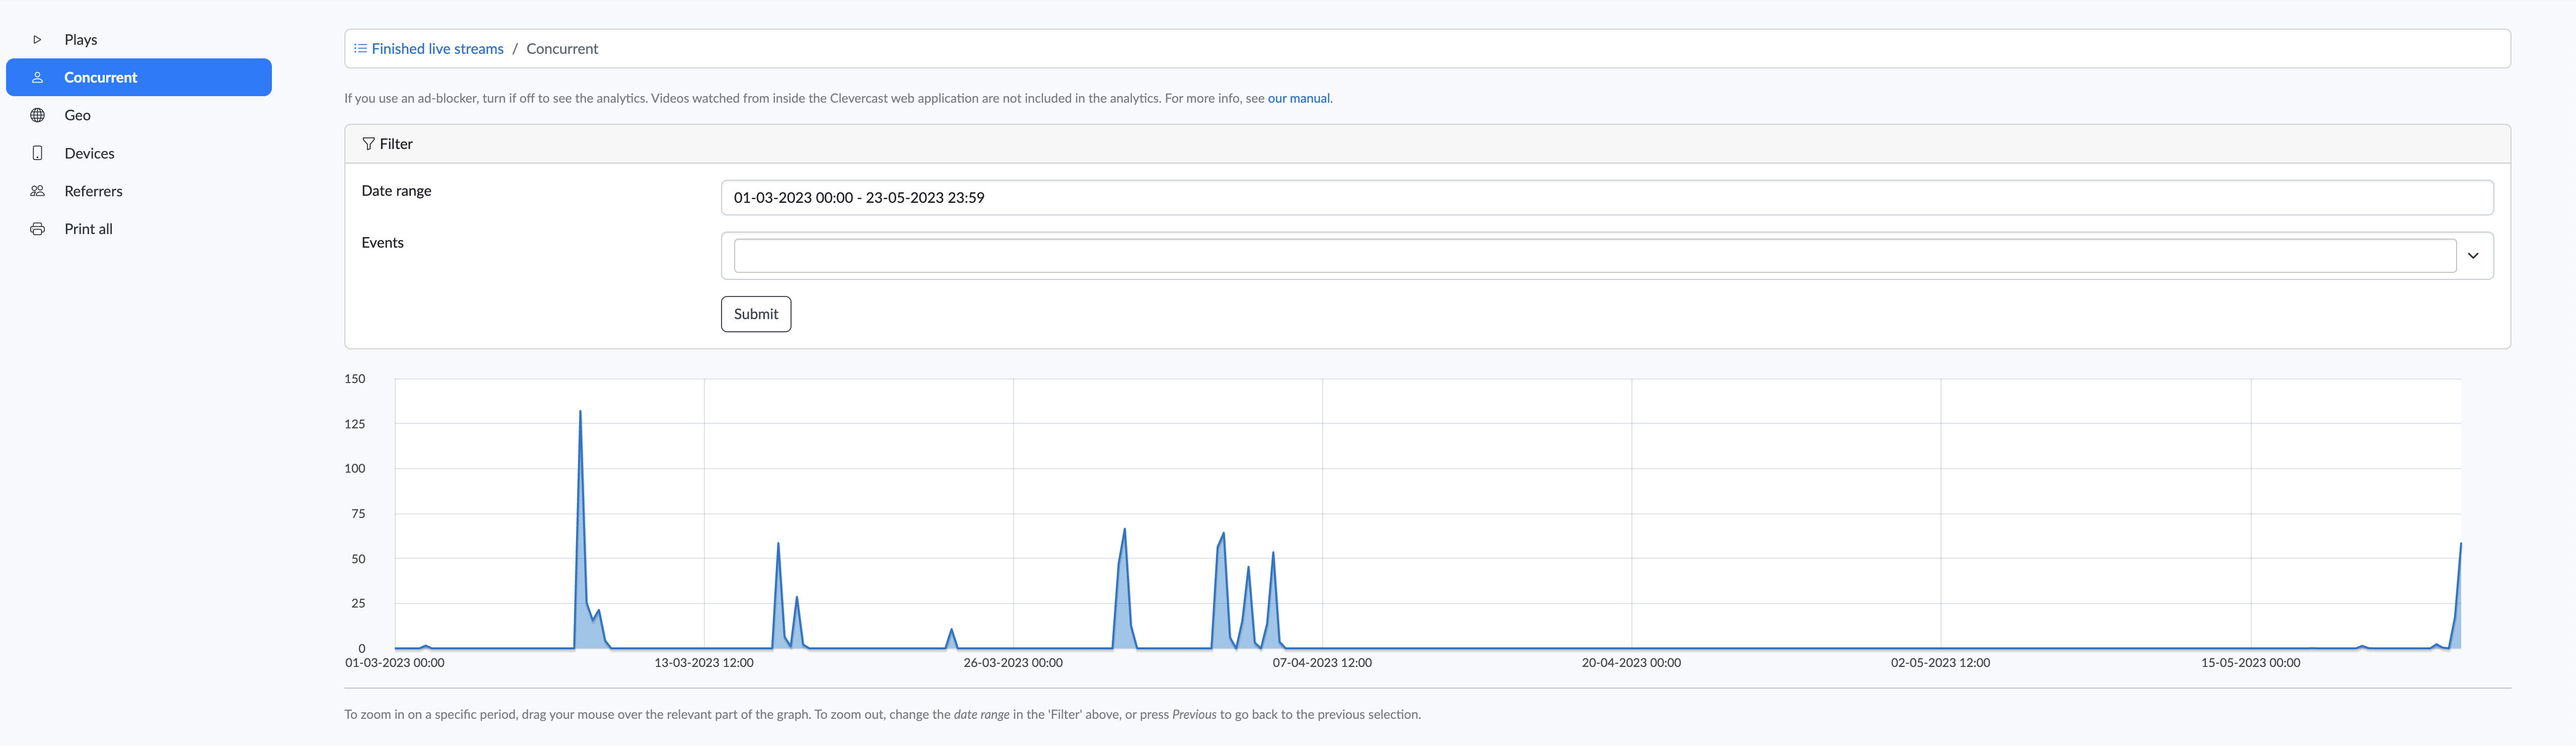
Concurrent
This graph shows how many concurrent viewers were watching live streams during a specific period of time. You can zoom in on a period by draggging your mouse over a selected time period, or you can use the filter to select the time period manually.
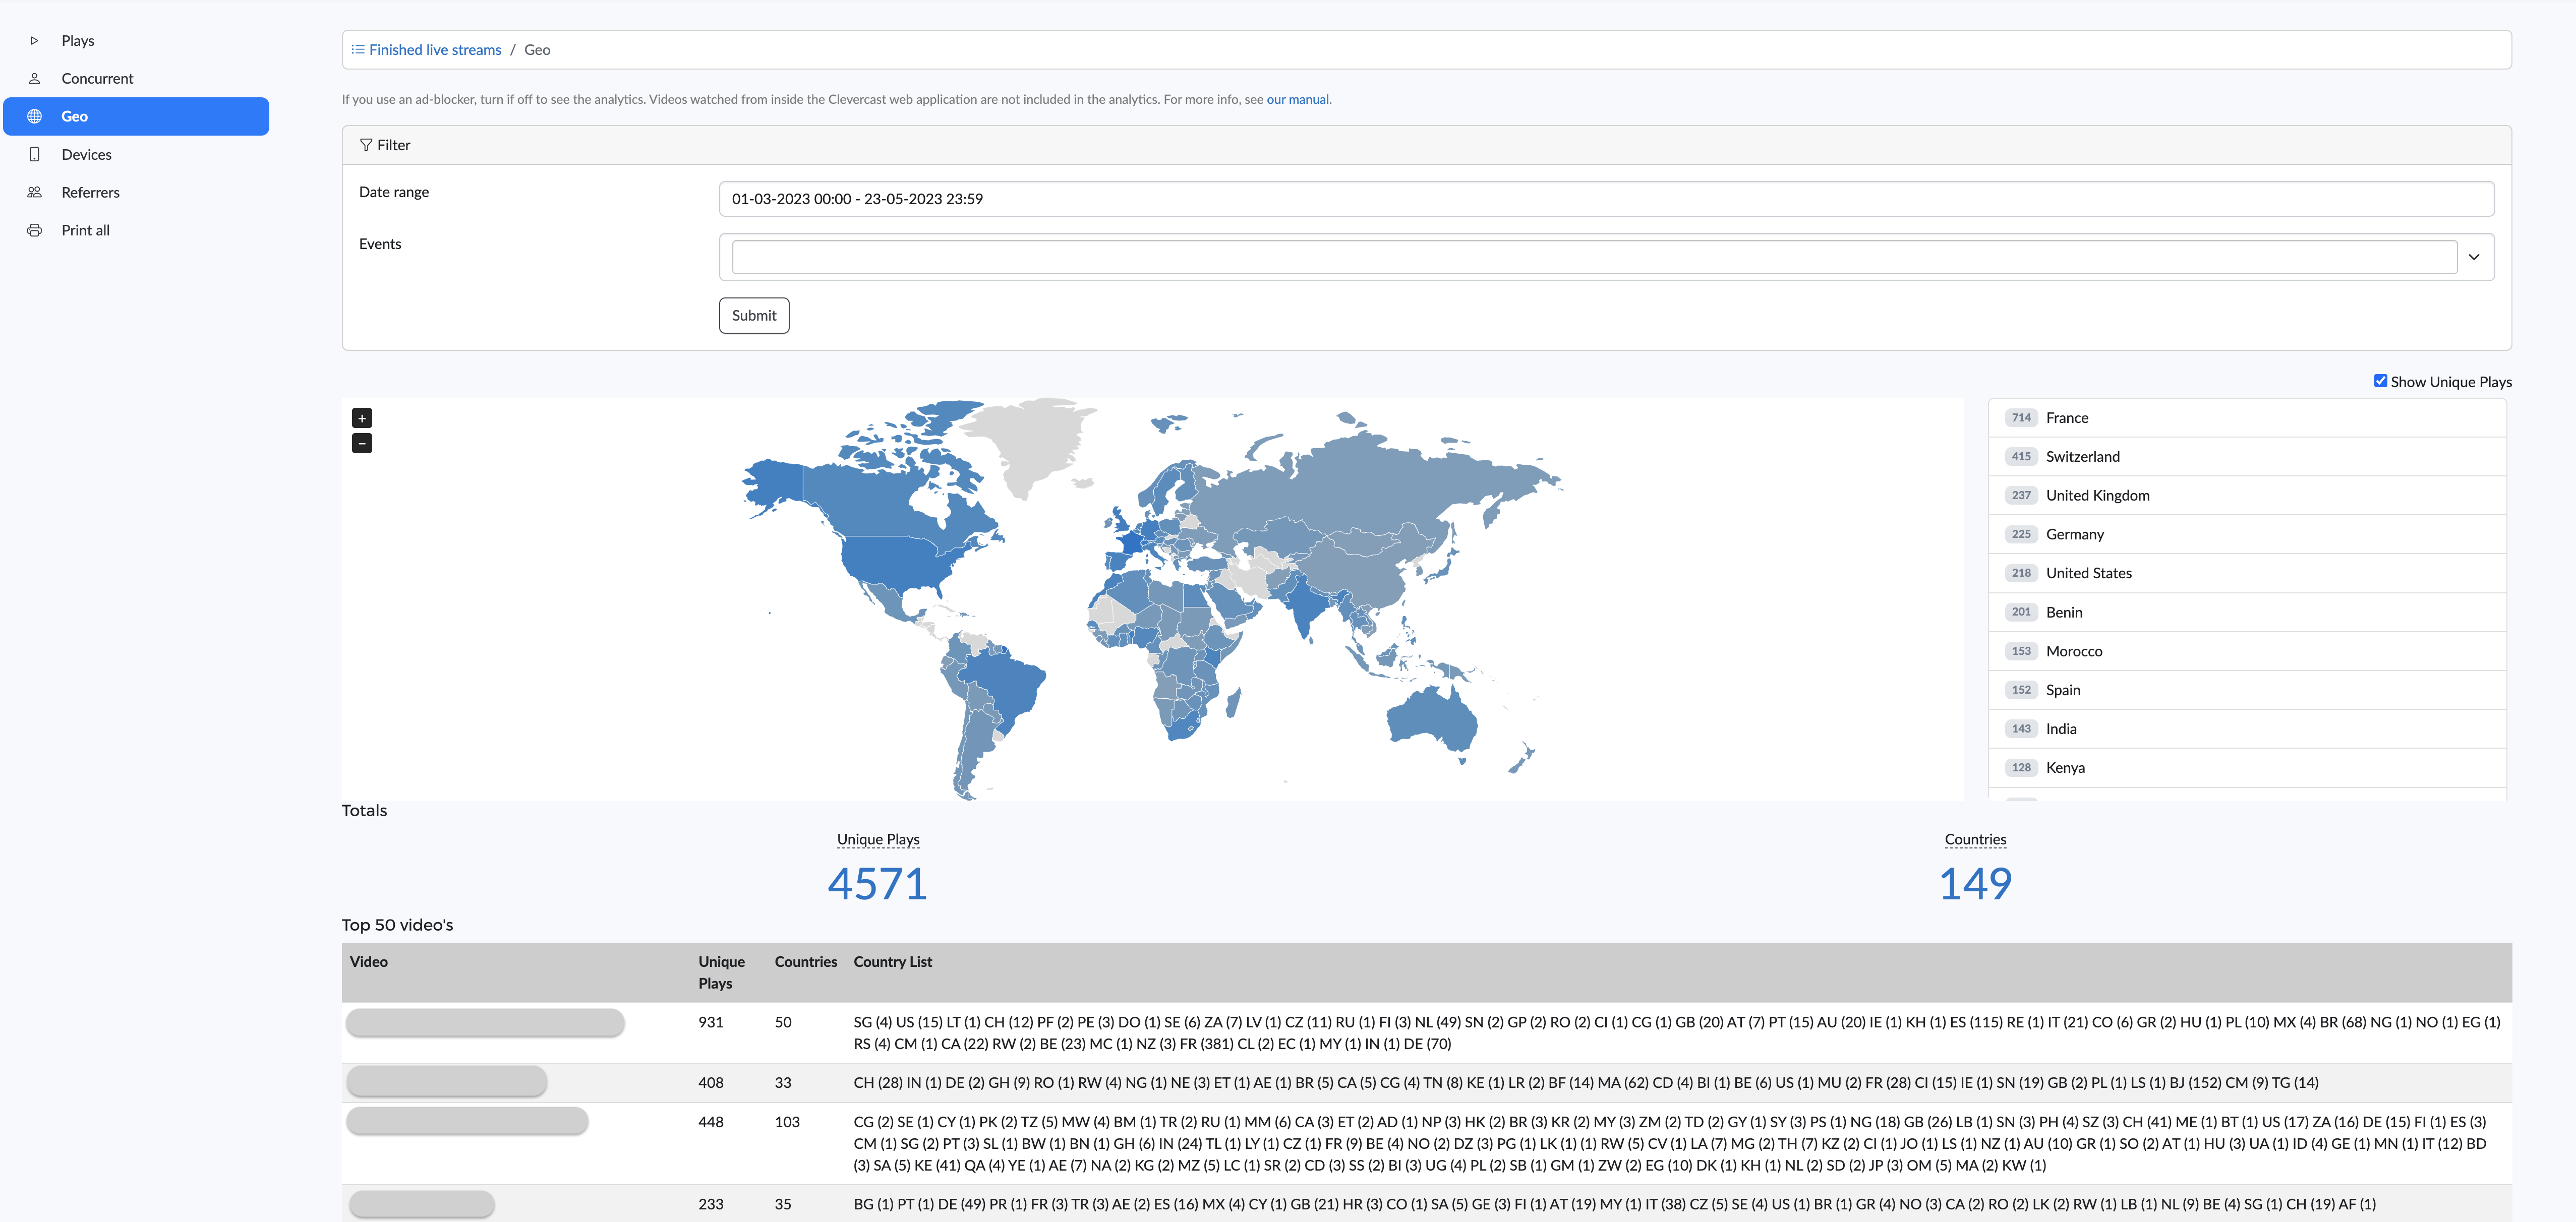
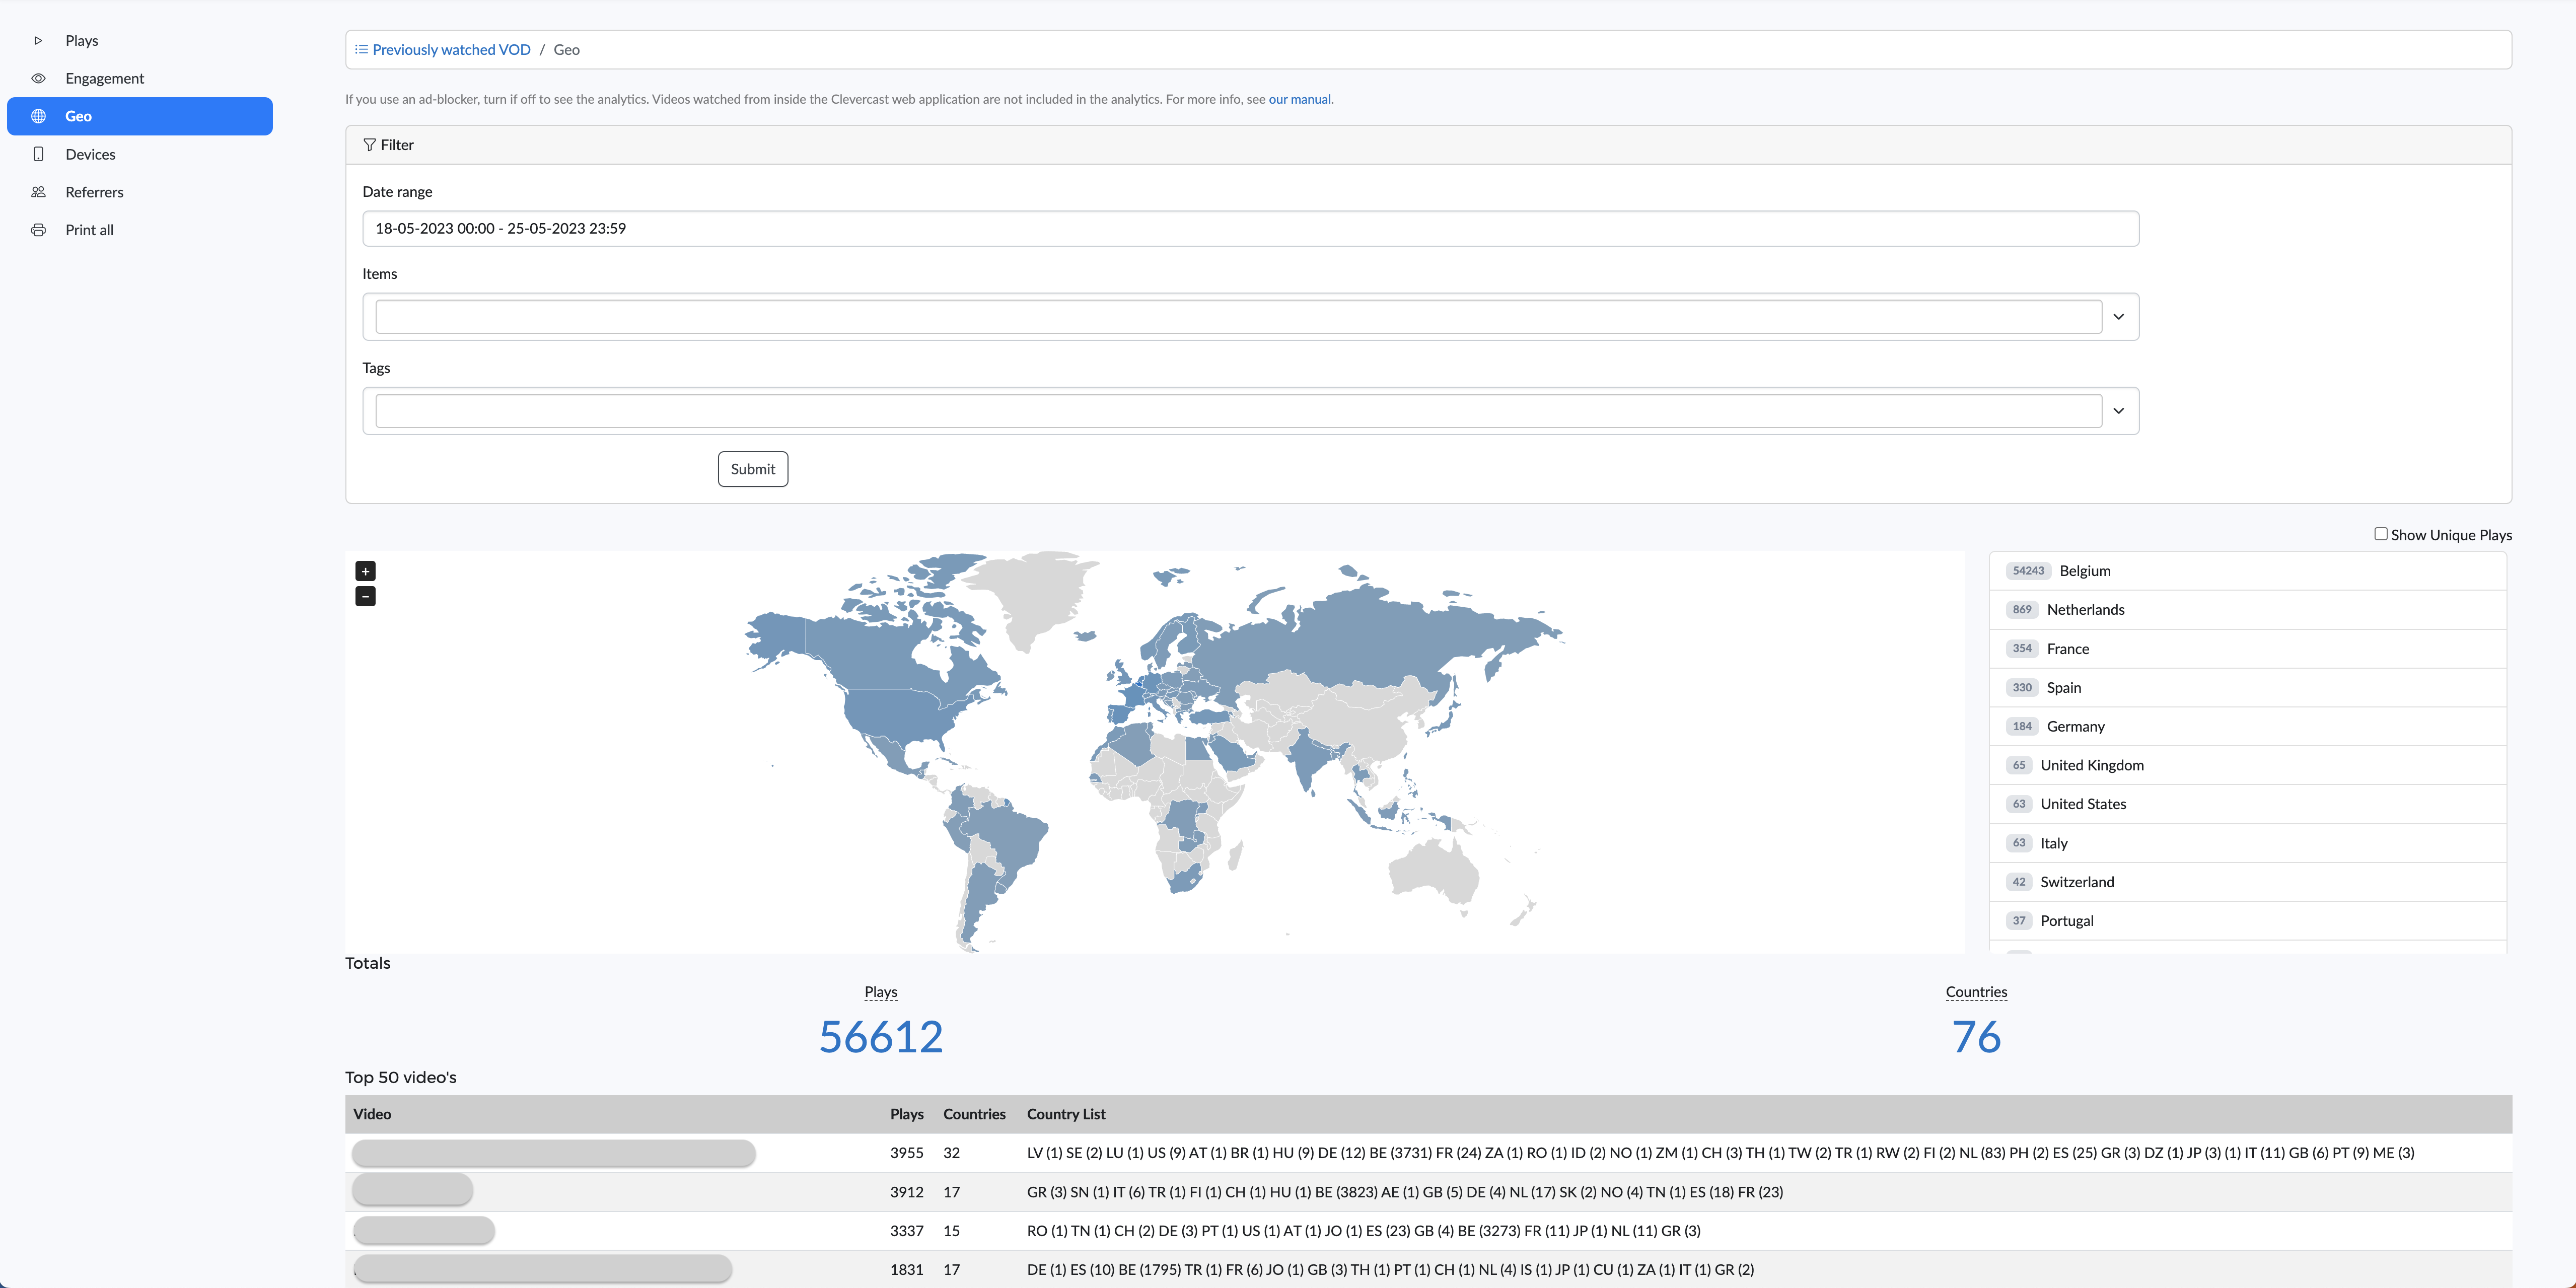
Geo
Like in the Plays tab, there is an overview of the geographical location of your viewers per country. While the top overview shows numbers of viewers and their countries for all your streams, there is an additional overview that provides a country list per live stream. When scrolling down, you'll find the top videos ranked from highest to lowest amount of plays.
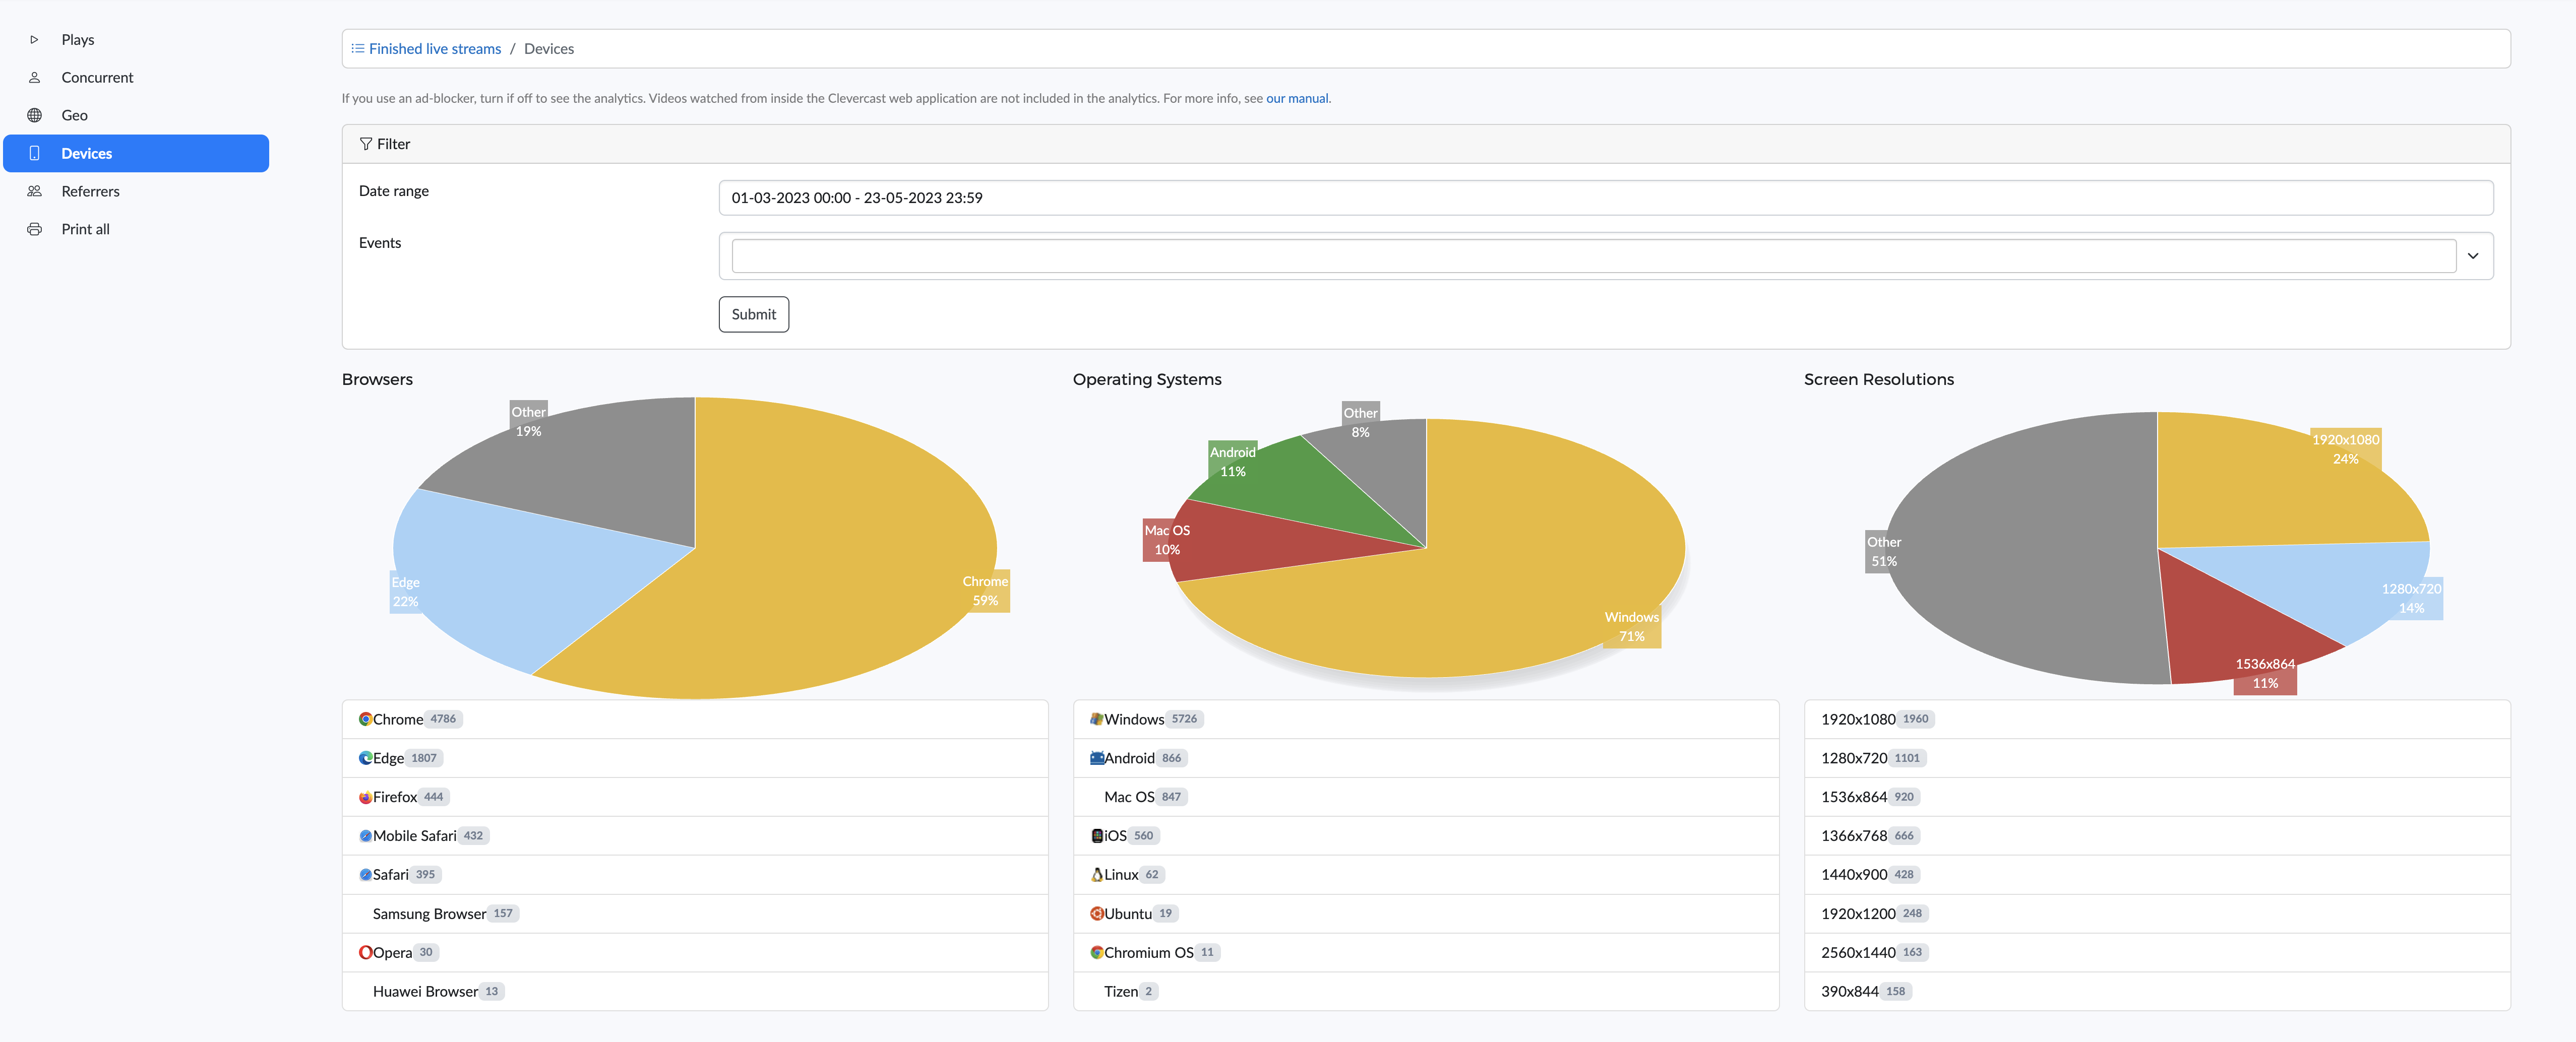
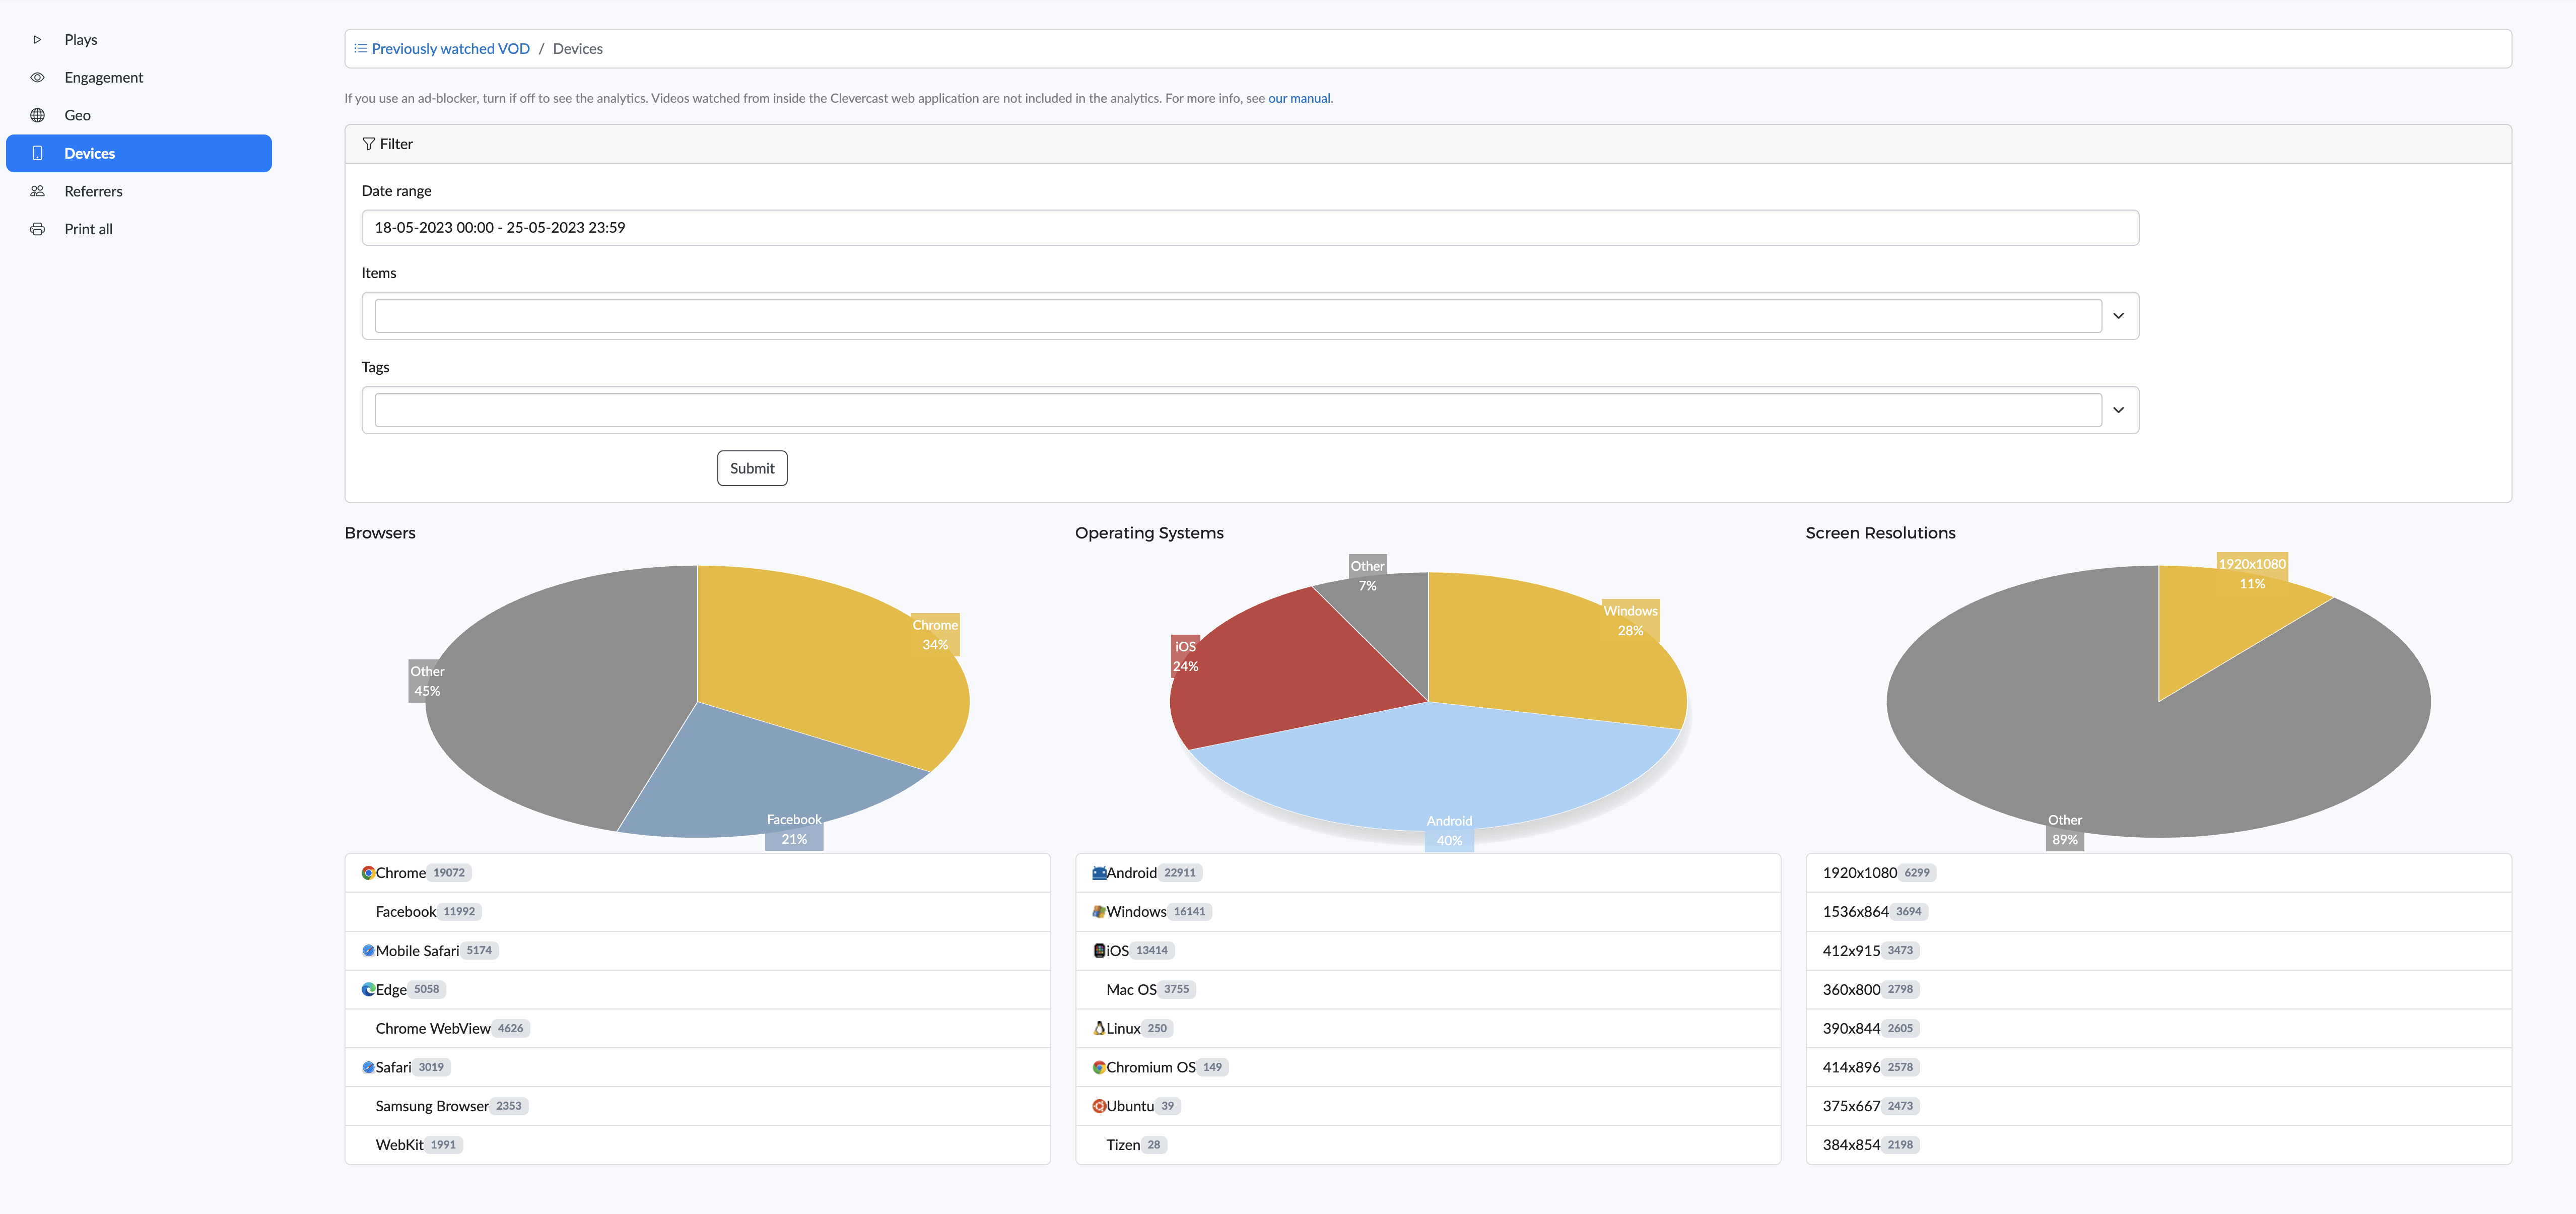
Devices
This tab shows an overview of which browsers were you used, which operating systems and which screen resolutions.
Referrers
The Referrers tab shows an overview of via which URL the live stream was watched.
Currently watched VoD
This menu shows the exact same information as the Active live streams menu: amount of concurrent viewers, visitor's countries and which videos are being watched now.
Previously watched VoD
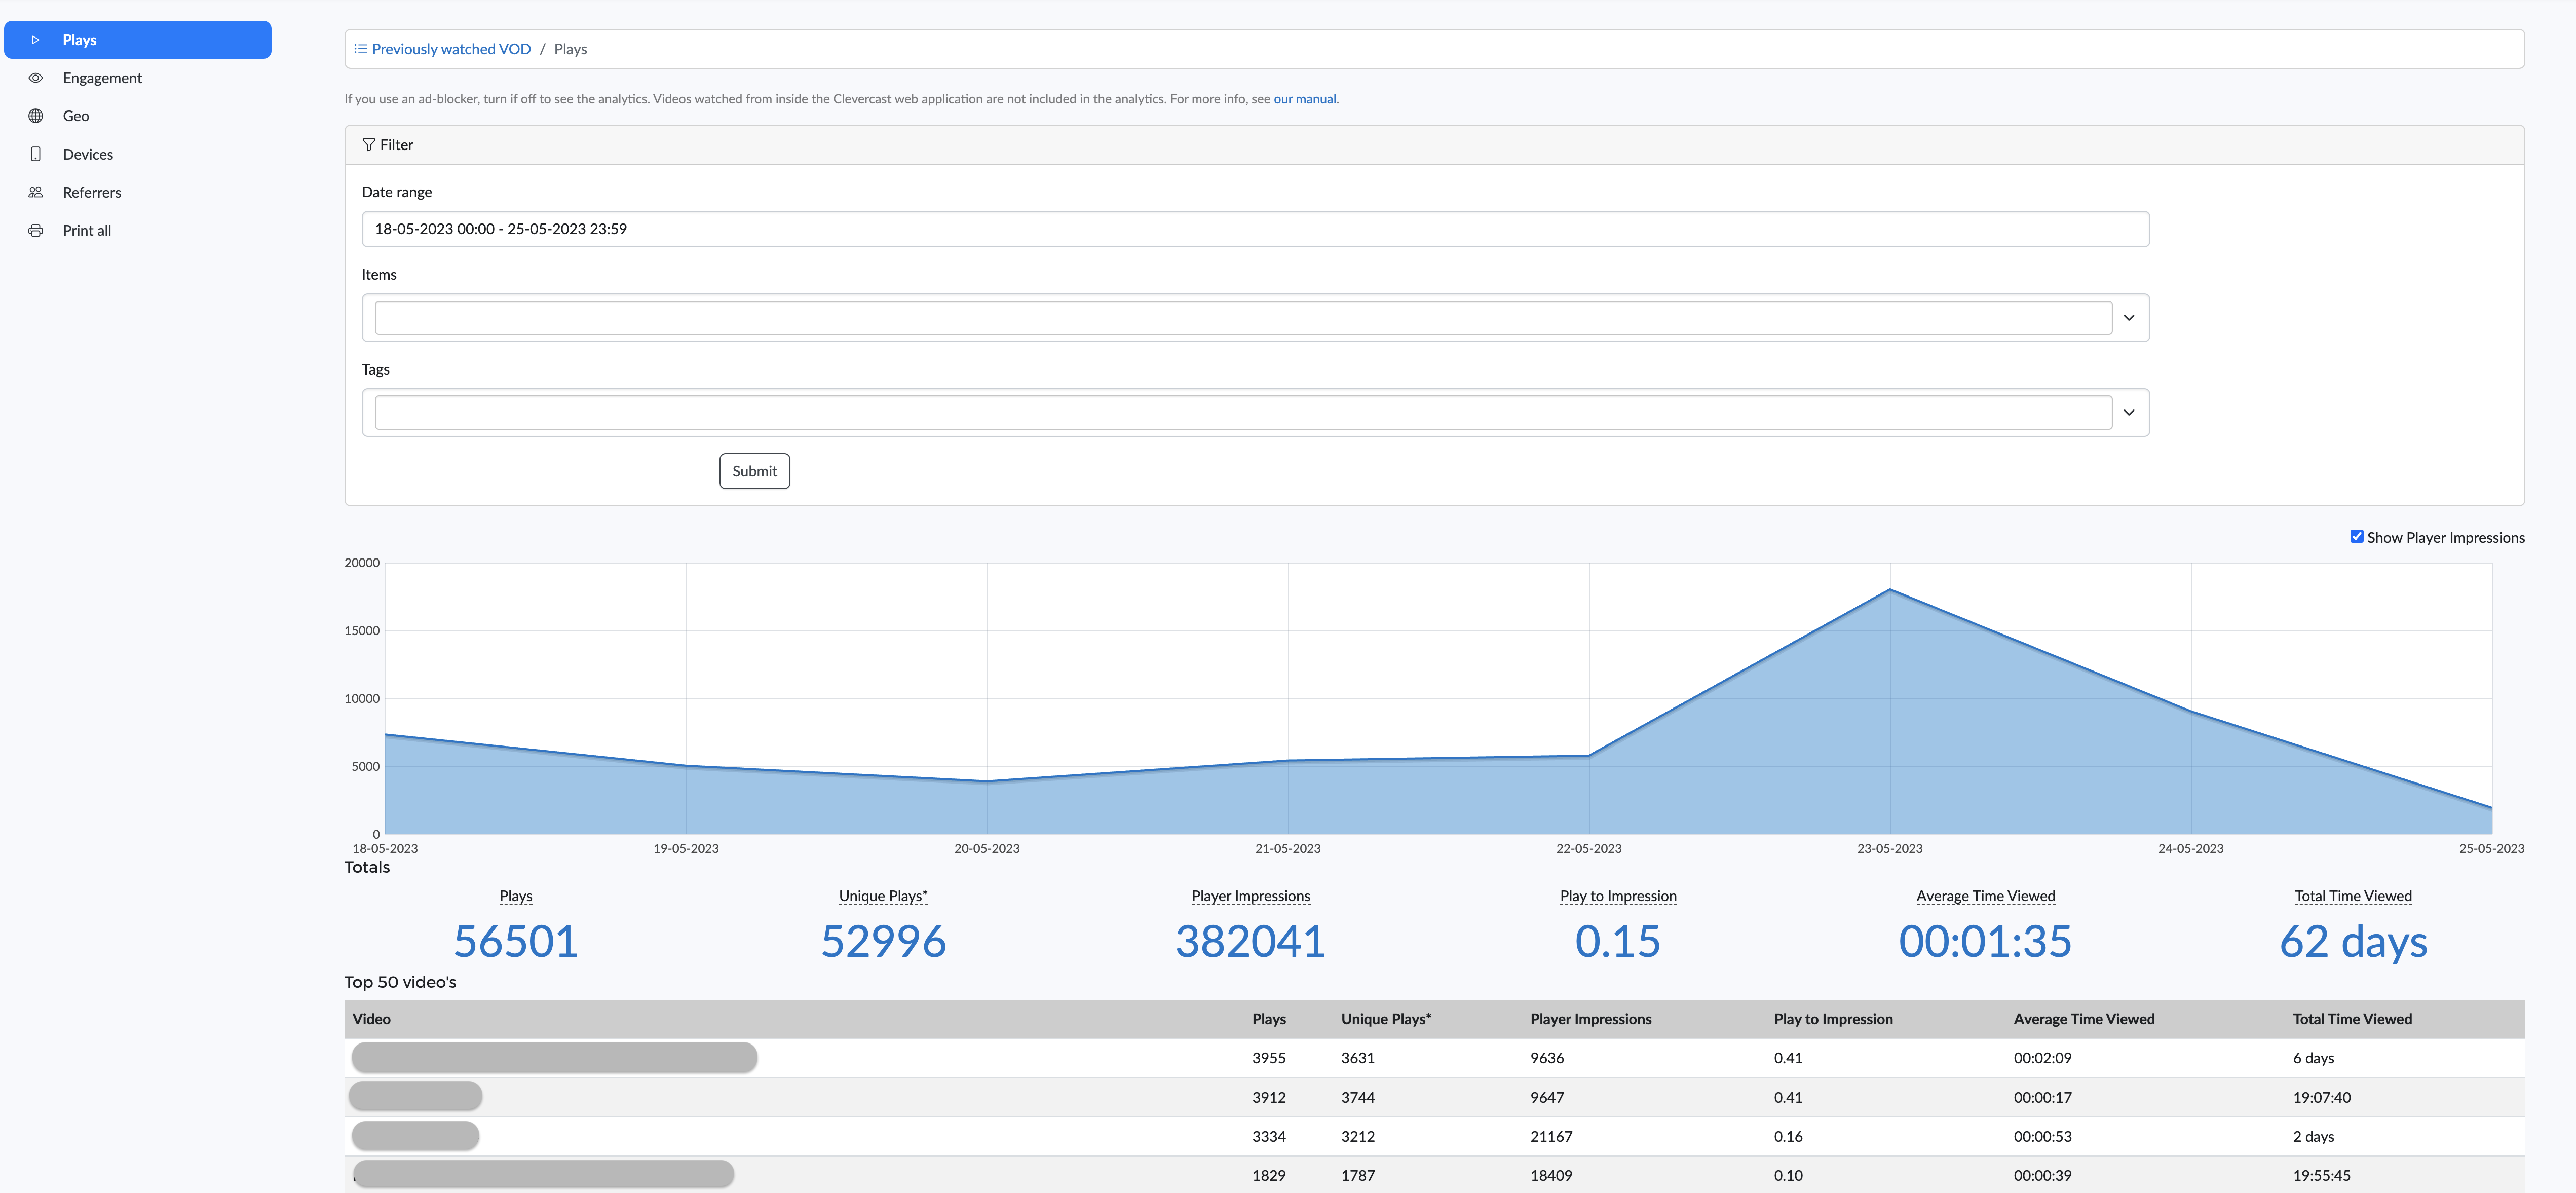
Plays
See the section of active live streams for more information.
Below you can find an overview of plays with 'Show player impressions' turned on.
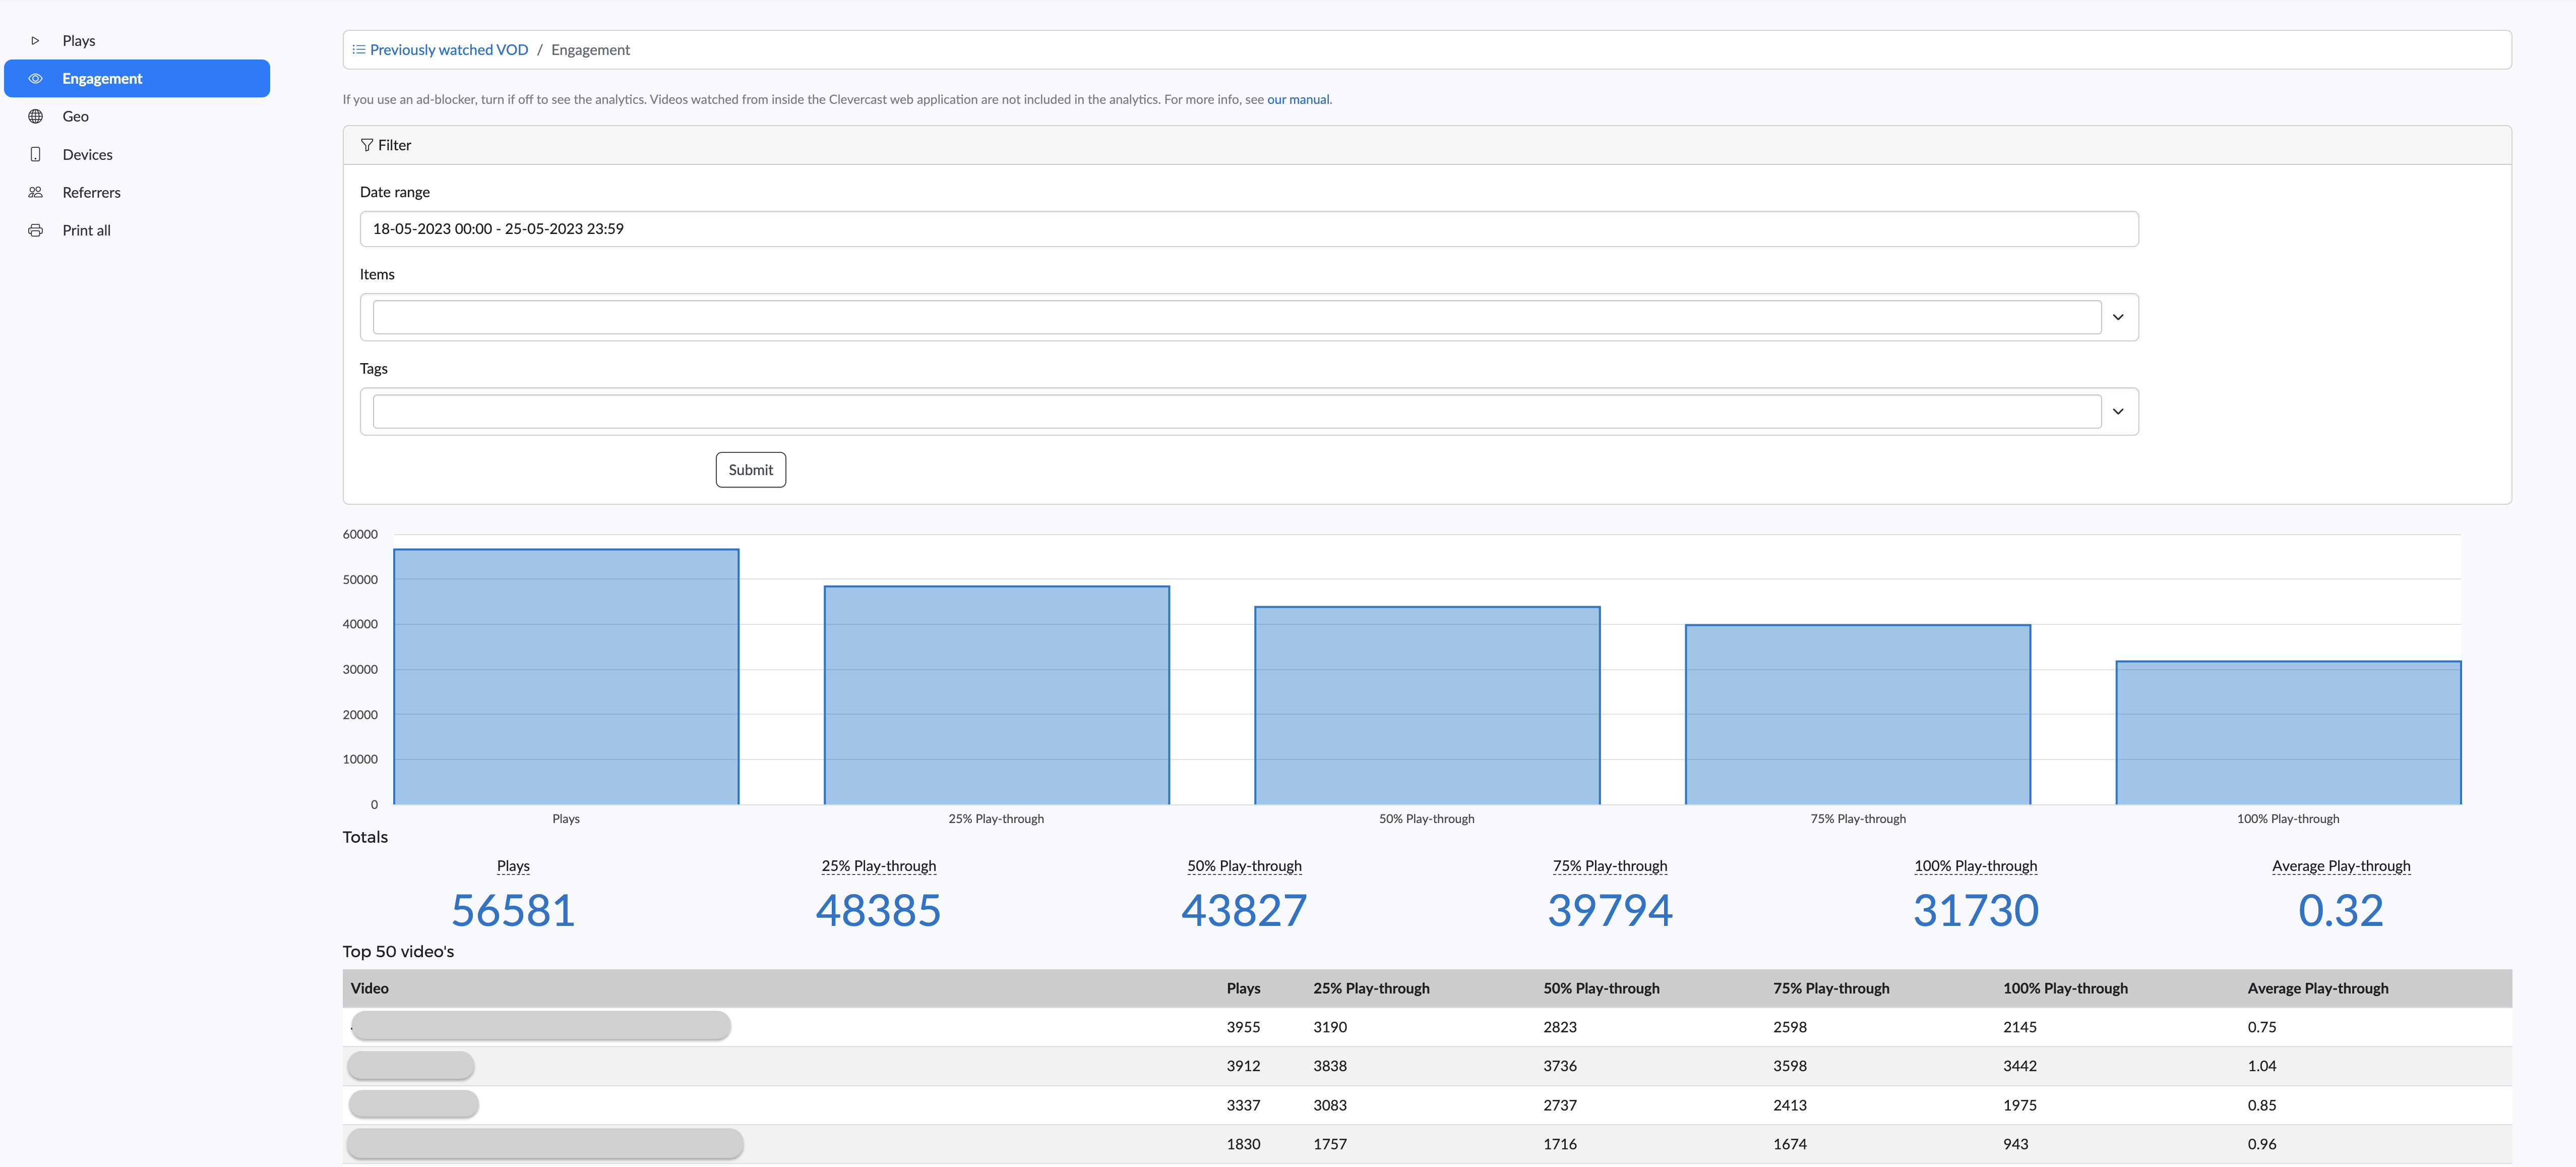
VoD Engagement
Engagement provides an indication of how many viewers watched how much of your Videos on-Demand, measured in play-through. Four percentages are discerned for this indication: 25%, 50%, 75%, and 100%. In the screenshot below, 583 viewers watched 25% of the VoDs.
Find more information on Plays and Play-through in the section above.
Geo
Find more information in the section above.
Devices
Find more information on Plays and Play-through in the section above.
Referrers
Find more information in the section above.
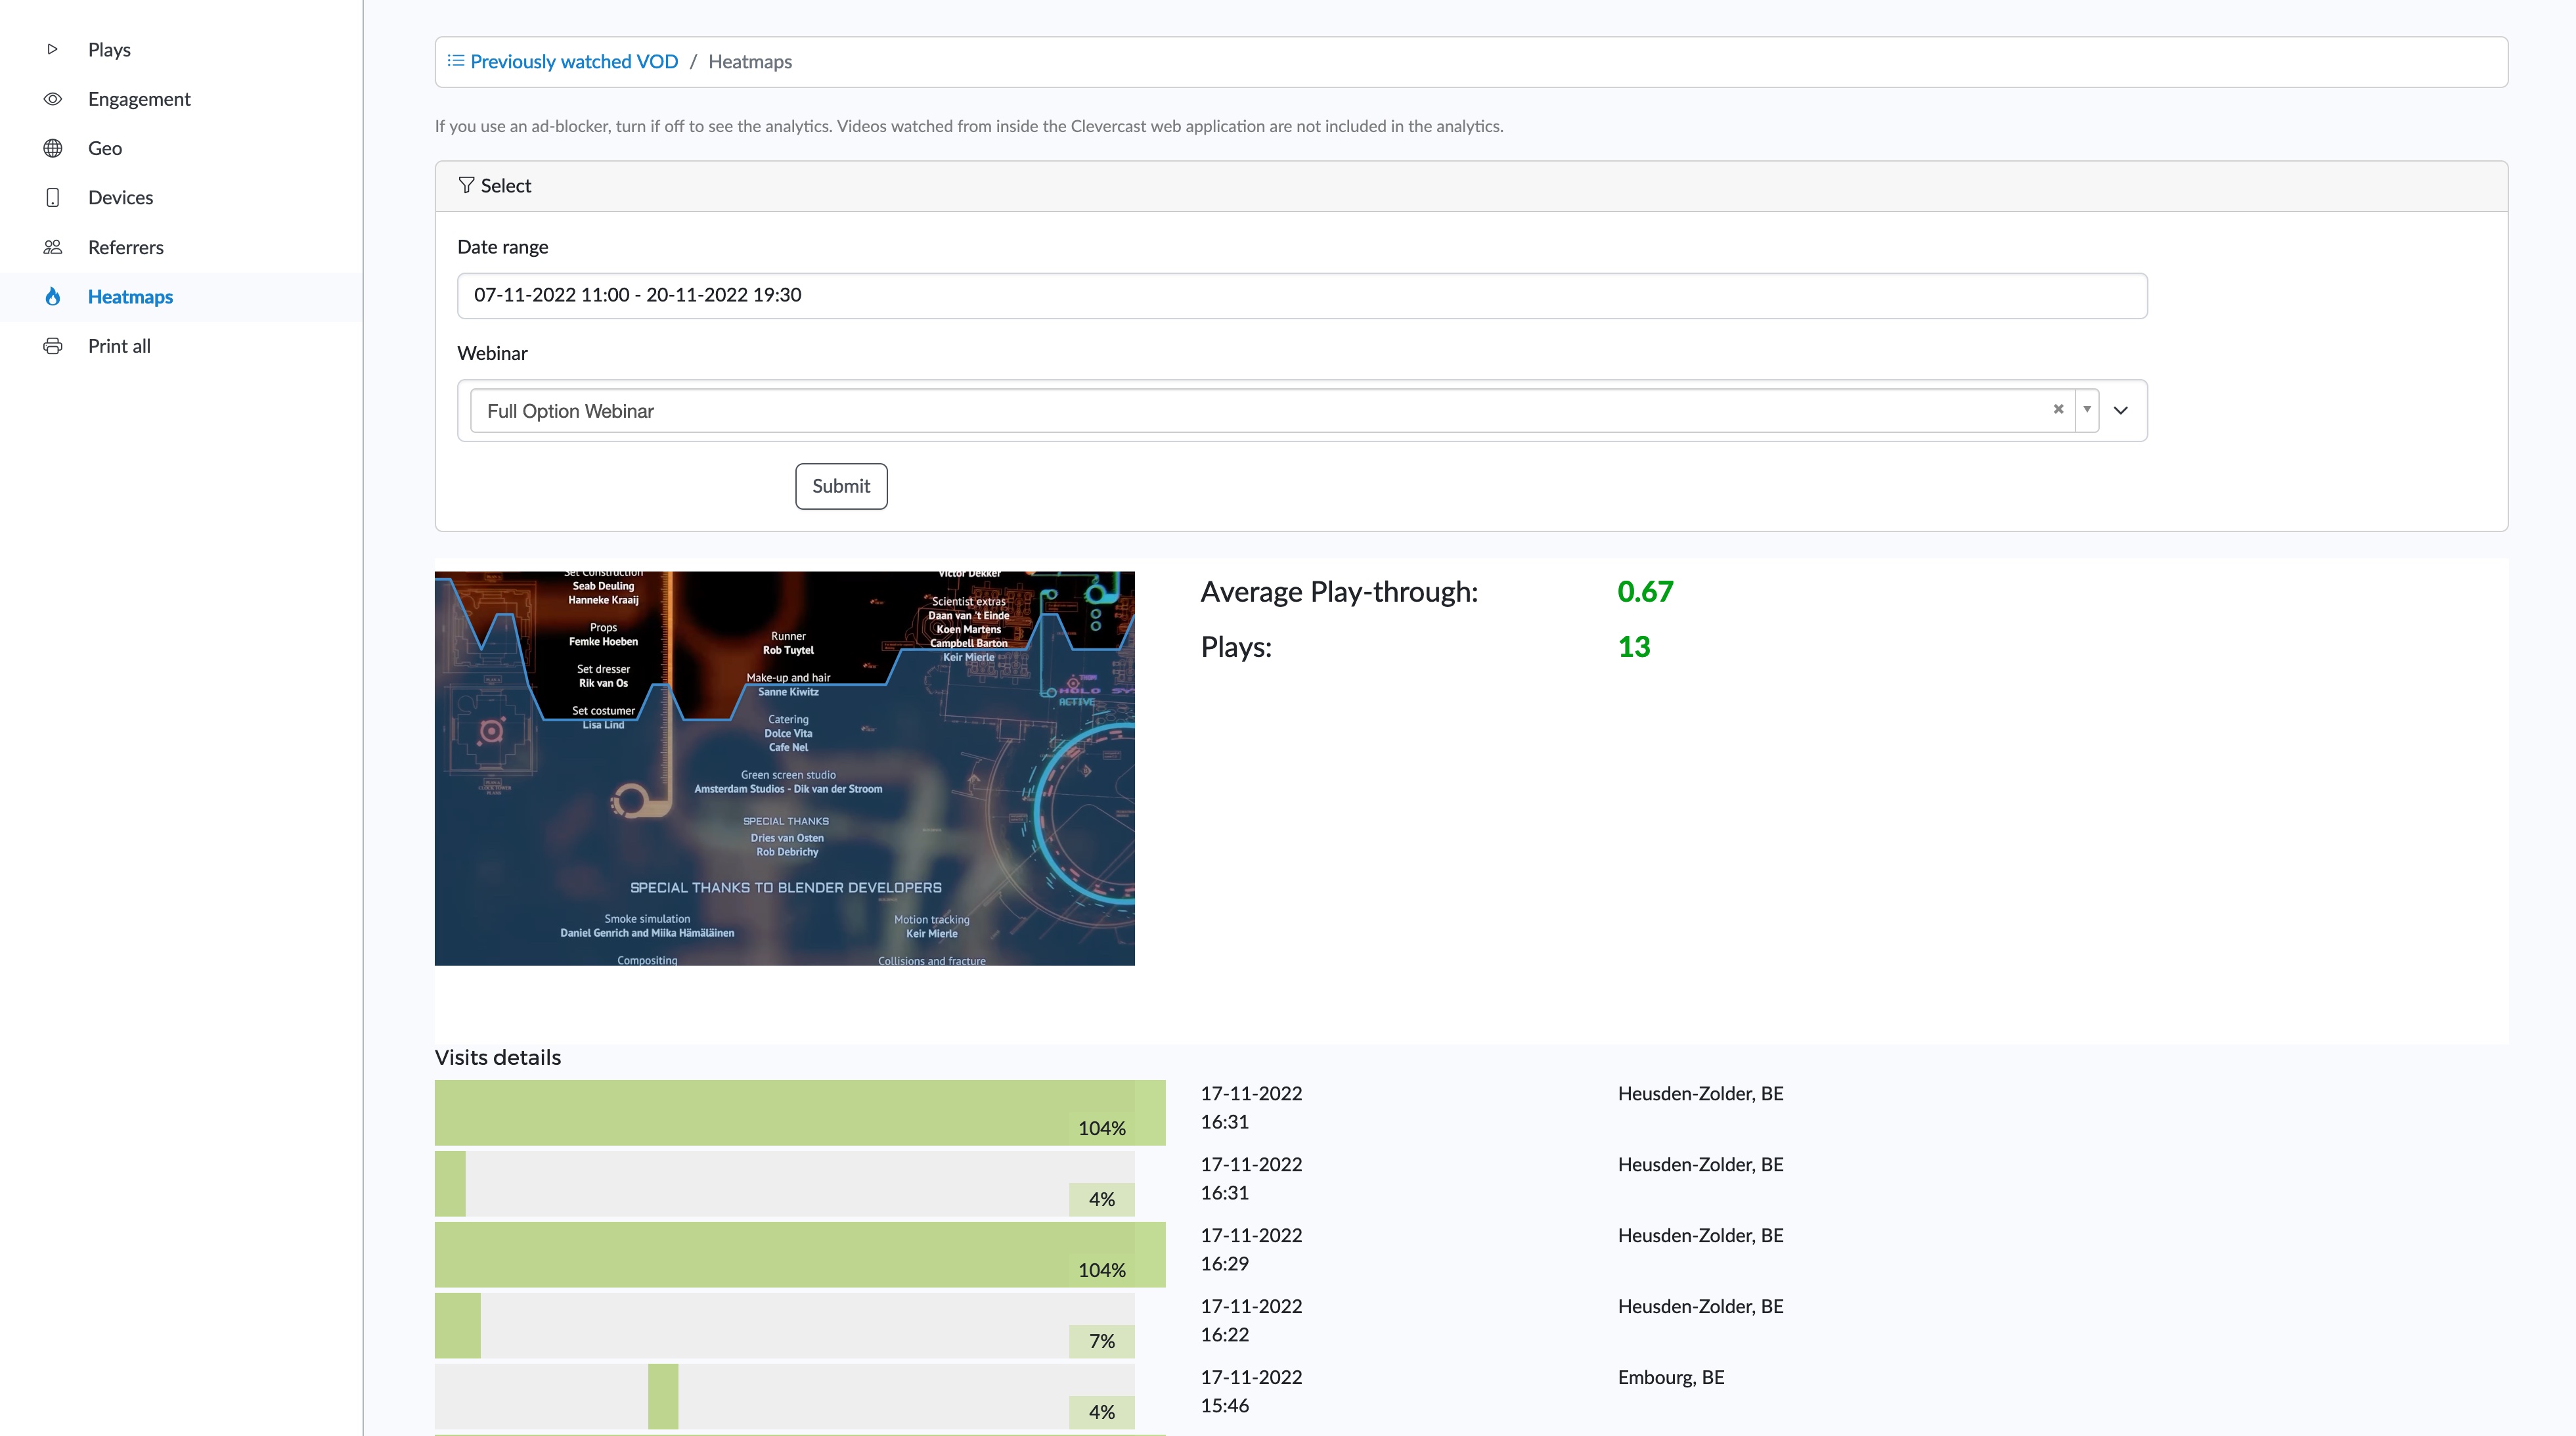
Video heatmaps
Video heatmaps are a powerful visual representation of the VoD viewing behaviour.
By dragging your mouse pointer over the video you see exactly which parts of the video are watched more than others, which parts do not seem to engage viewers, and which parts are watched more than once, indicating particular customer interest.
Heatmaps are presented both as aggregate data as well as on the individual level with an approximation of the geographical location of the viewer.